
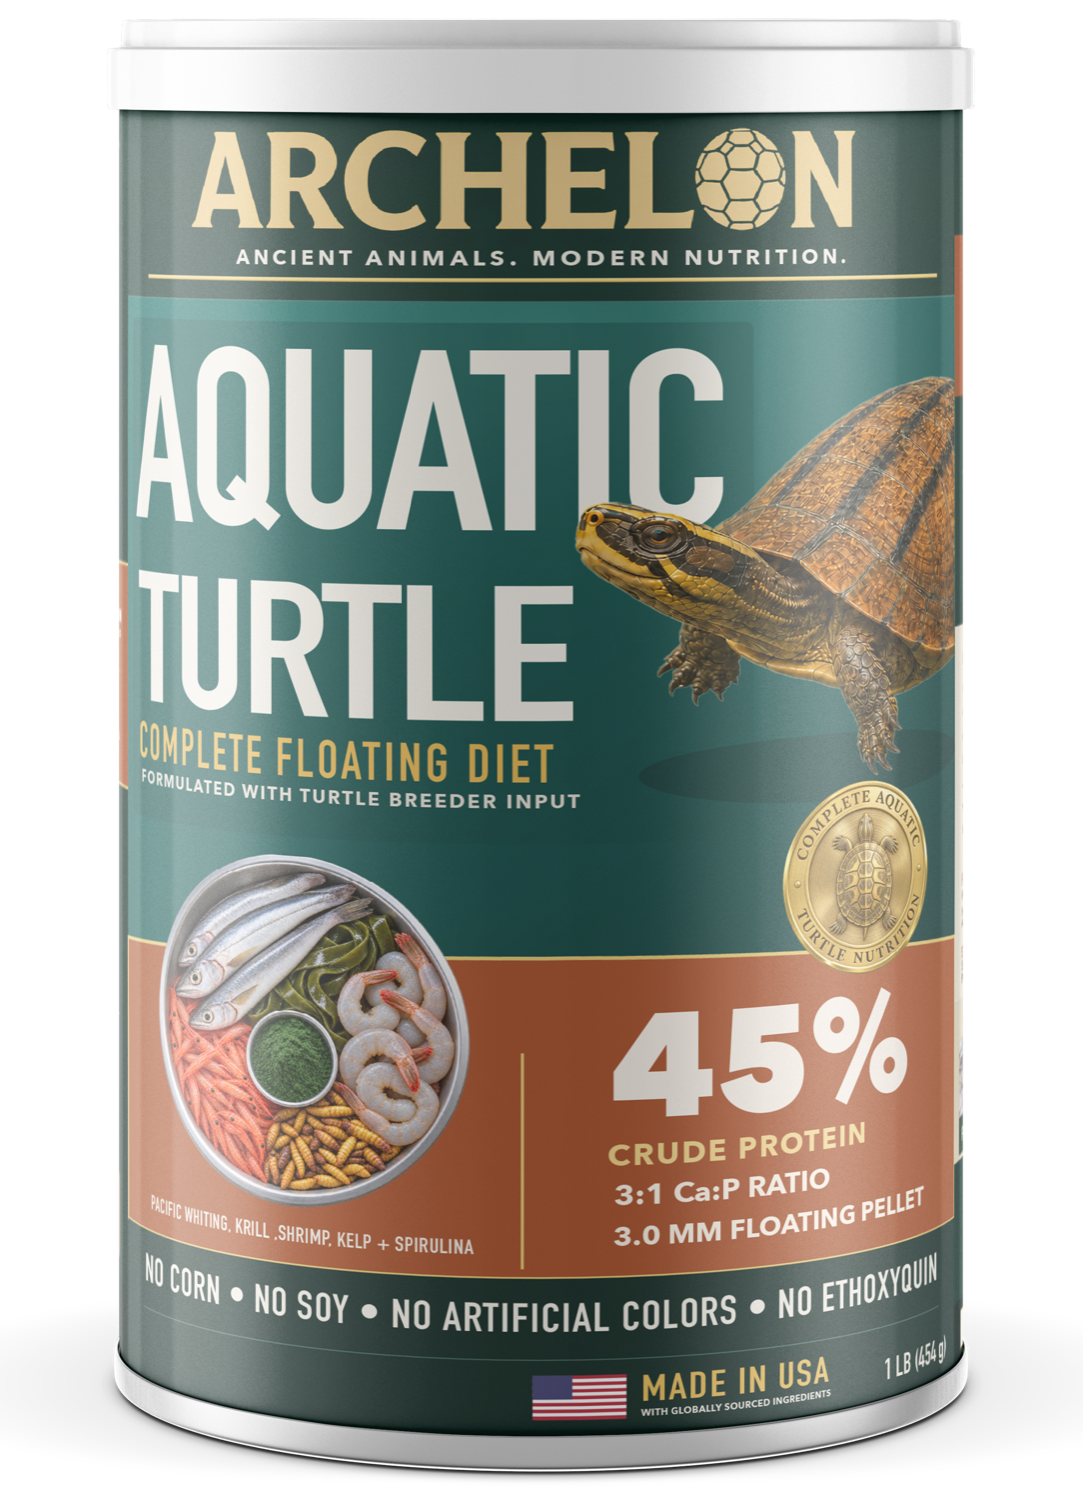
Archelon
Aquatic & semi-aquatic turtle food
Actual package designFront labels can look alike. Ingredient lists and guaranteed analyses tell a more useful story. Explore how Archelon compares with seven aquatic turtle foods in the supplied chart.
Four products, side by side. These are selected examples from the supplied September 30, 2026 chart. Compare guaranteed values and ingredient order without a dropdown.
Aquatic & semi-aquatic turtle food
Actual package design
Chart-anonymized product
Illustrative pack
Chart-anonymized product
Illustrative pack
Chart-anonymized product
Illustrative pack“Minimum” and “maximum” are guarantee qualifiers, not measured amounts. Brand 6 also lists 45% minimum crude protein. Archelon's 3:1 calcium-to-phosphorus claim comes from its package; competitor calcium and phosphorus guarantees are shown separately because dividing minimums does not establish a finished food's actual ratio. Competitor package shapes and colors above are illustrative, not images of real products.
A useful comparison goes beyond a single large number on the front of the package.
These guarantees give a starting point for comparing formulas. They are minimums, so they do not tell you the exact amount in every serving or the quality of the protein source.
Calcium and phosphorus matter in turtle diets, particularly for shell and skeletal nutrition. Read both figures and their qualifiers; minimum guarantees alone do not prove an exact finished-food ratio.
Ingredients are listed in descending order by weight before processing. The first ingredient is informative, but the complete list and guaranteed analysis provide better context together.
These brands remain anonymized as in the supplied source. Each card shows selected guaranteed-analysis values and the first five ingredients in listed order.
First five: “Fish” Meal, Poultry By-Products, Ground Corn, Dehulled Soybean Meal, Wheat Middlings.
First five: “Fish” Meal, Dried Bakery Product, Wheat Flour, Soybean Meal, Brewers Dried Yeast.
First five: “Fish” Meal, Ground Corn, Dehulled Soybean Meal, Corn Gluten Meal, Chicken Meal.
First five: Salmon, Wheat Flour, Herring, Wheat Germ Meal, Shrimp.
First five: Ground Corn, Chicken Meal, “Fish” Meal, Corn Protein, Calcium Carbonate.
First five: Wheat Gluten, “Fish” Meal, Wheat Starch, Dried Yeast, Shrimp Meal.
First five: “Fish” Meal, Soybean Meal, Wheat Flour, Wheat Starch, Shrimp Meal.
Source: user-supplied “ARCHELON Comparison Charts 2026-09-30” (September 30, 2026). Product labels can change. Archelon’s package label controls its claims and ingredient wording where the chart differs. Review current product labels before purchasing.
View the source chart (PDF) ↗See the full package label or join the launch list for product updates.